TD Regression Deep Dive Series: Running Backs (Part One)
With the 2019 fantasy football season behind us, there is one word that you’ll be hearing over and over… and over again this off-season: Regression. What is it and how does it impact the fantasy outlook of players?
At a base level, regression for fantasy is the expectation for players to revert back to the mean or league average over time. This led me to the following question: In a game with so many nuances, is this the right way to approach it?
It seems like every time a player excels beyond what is considered “the norm”, people are quick to slap the outlier label and call for regression without much consideration for the player or their surrounding circumstances. The problem with this approach is that:
- Elite players exist who are just better than the simple average
- Some players have better situations that allow them to excel beyond the norms
- It takes time to regress so you potentially miss out on elite production in the interim by taking a blanket approach
This is why I decided to explore a different approach to analyzing regression as a topic. In this Regression Deep Dive series, I attempt to apply a more systematic approach to analyzing regression that goes a layer deeper than simple averages while incorporating both quantitative and qualitative factors to break down this concept which we have all heard of but don’t truly understand… yet. I will be breaking down the analysis by position group and in this first installment, we’ll be going over the least important position in the NFL but arguably the most important position in fantasy… running backs.
My regression process is broken down into the following key steps. If you follow me on Twitter (@MikeMeUpP), this may look familiar but I will also introduce some other concepts I wasn’t able to get into before given the limitations. Without further to do, let’s dive right in.
Step One: TD Dependency
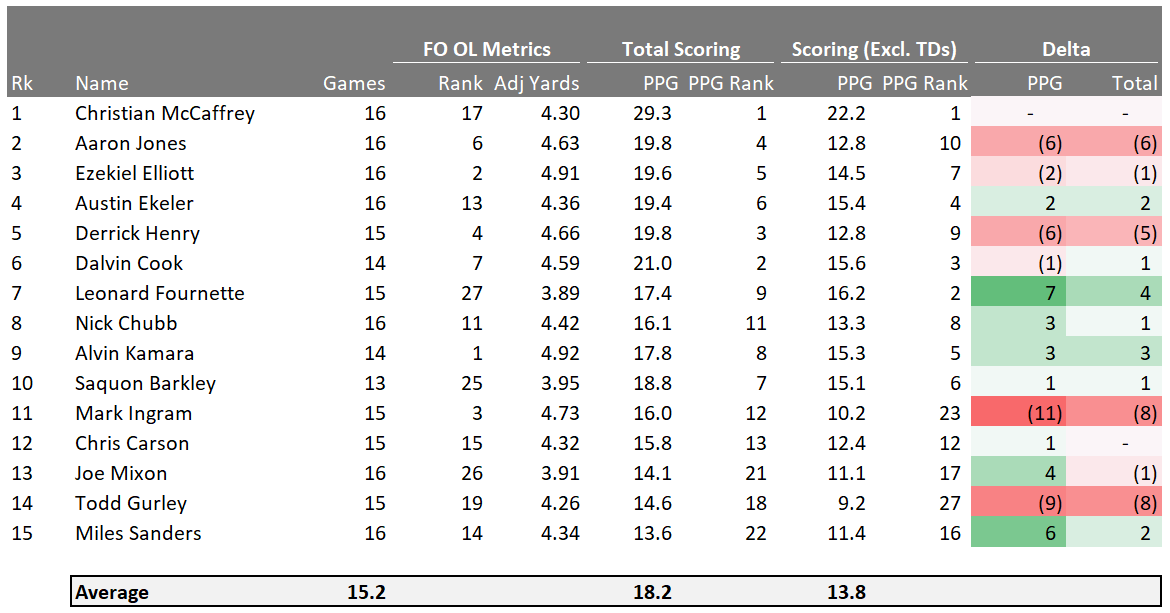
The table above shows how the top 15 running backs scored in 2019 including TDs versus excluding TDs. The point is to show how dependent each player is on TDs for their positional ranking which helps us identify the players who might be impacted the most with potential TD regression. I have also included the offensive line run blocking rankings from Football Outsiders for reference to see if there are any potential takeaways.
Below are the most TD-reliant running backs and their respective run blocking rankings:
- Mark Ingram – Third
- Todd Gurley – 19th
- Aaron Jones – Sixth
- Derrick Henry – Fourth
And the least TD-reliant running backs and their respective run blocking rankings:
- Leonard Fournette – 27th
- Alvin Kamara – First
- Miles Sanders – 14th
- Austin Ekeler – 13th
Not many surprises here but definitely a couple of interesting takeaways. First, every single one of the TD-reliant running backs run behind a top-six offensive line with the exception of Todd Gurley. In my opinion, this is a red flag and is a qualitative indicator of potential regression. Conversely, with the exception of Alvin Kamara, the least TD-reliant running backs run behind an average to well-below-average offensive line. This trend makes some intuitive sense as the top run-blocking units lead to more rushing TDs while the others likely rely on getting the ball out quick on short passes to compensate which is money in PPR scoring.
Too often, the regression analysis stops here.
“Aaron Jones scored too many TDs, there’s no way he can keep this up so sell now!”
But as I mentioned, I don’t think this provides the full picture which is why we’ll be digging deeper than normal here by proceeding to the next step.
Step Two: TD Distribution
The next step of the process digs into the breakdown of TDs scored by running backs inside 10 yards and five yards. Why is this important to look at? As we all know, the likelihood of converting a TD grows substantially the closer we get to the goal line. For running backs, I typically focus on within ten and five yards versus the standard 20-yard NFL red zone given how drastically the conversion percentage drops. As you can see in the table below, a touch within five yards is over 2.4 times as likely to convert into a TD compared to a carry within 20 yards.

Now let’s take a look at how this shakes out for the top 15 running backs from 2019:
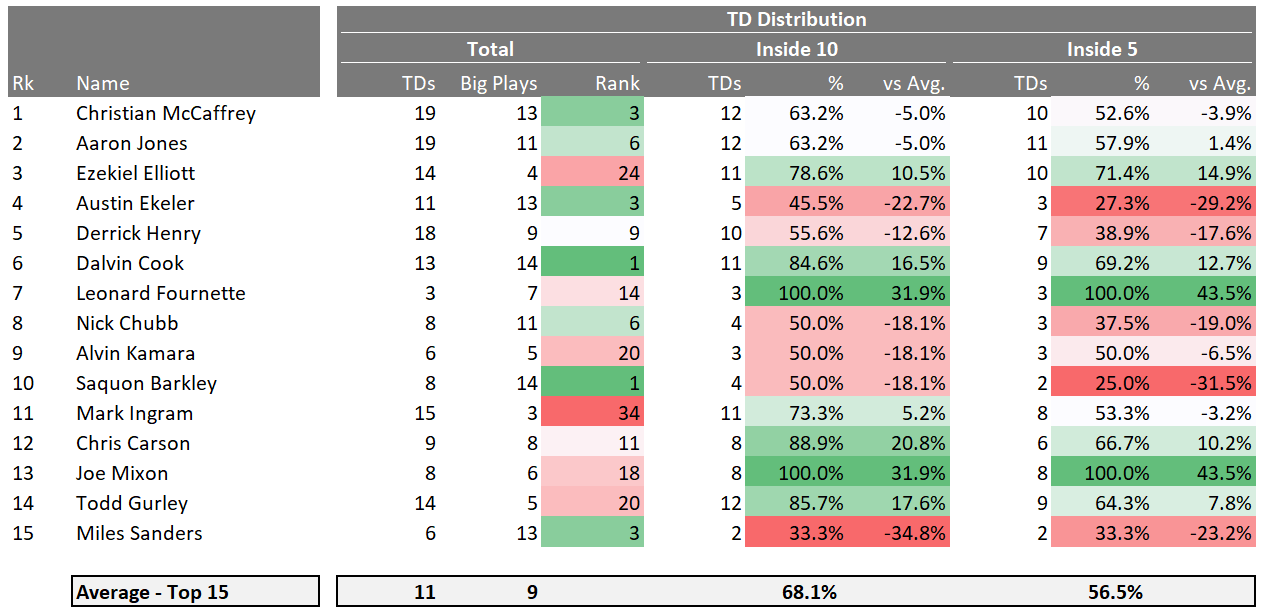
The way to interpret this table is that those with lower percentage of their TDs scored inside ten and five are potential candidates for regression as those TDs are less sticky and more difficult to repeat year over year. I have also included a column for the number of “Big Plays” which I define as carries or receptions that went for more than 20 yards and the respective ranking for each player compared to all other running backs in the NFL. The logic here is that players who have a tendency to break big plays are more likely to do so again. I don’t think this completely negates the potential for regression but it certainly may reduce its impact.
Based on the above, potential candidates for regression along with their Big Play rankings are:
- Austin Ekeler – T-third
- Derrick Henry – Ninth
- Nick Chubb – Sixth
- Saquon Barkley – T-first
- Miles Sanders – T-third
Not a surprise here that all of these candidates are some of the best in the league at creating big plays with Barkley leading the pack in a tie with Dalvin Cook – both are incredible players and top five dynasty assets. Of all of the above, I’d say that Henry is the most likely regress from a TD distribution perspective given he is middle of the pack in the top 15.
Meanwhile, TDs for the below players should be much easier to sustain:
- Ezekiel Elliott
- Joe Mixon
- Leonard Fournette
- Dalvin Cook
- Chris Carson
If you’re thinking this is as far as we go, you’d be wrong. Didn’t I tell you we are diving deep into the trenches on the analysis? Roll up your sleeves cause we’re on to the next step of the analysis…
Step Three: Red Zone Efficiency
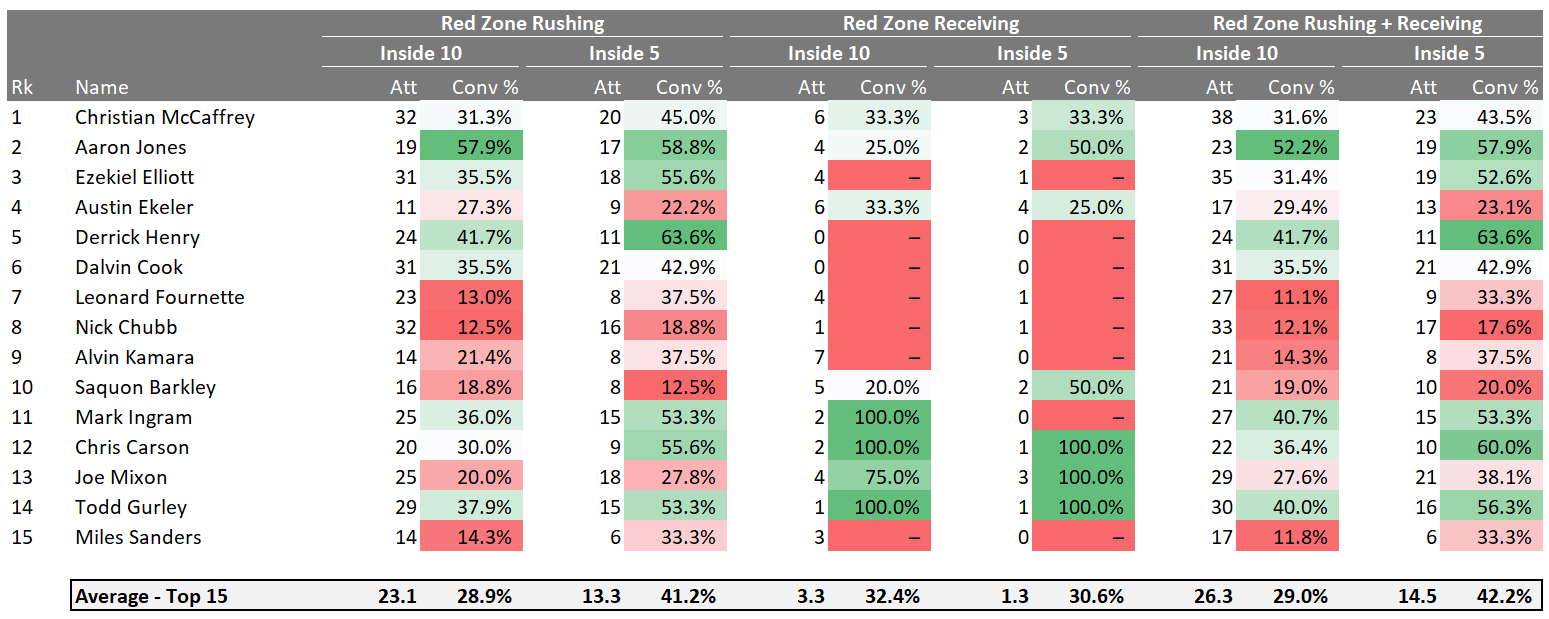
The next step of this analysis covers one of the most important aspects of scoring TDs. The above table shows the number of attempts and the corresponding TD conversion percentage for each player. Again, I will be focused on inside ten and five yards as opposed to 20 for the reasons I mentioned in step two above.
Based only on the table above, the potential candidates for negative regression are:
- Aaron Jones
- Derrick Henry
- Mark Ingram
- Todd Gurley
The potential candidates for positive regression are:
- Leonard Fournette
- Nick Chubb
- Alvin Kamara
- Saquon Barkley
- Miles Sanders
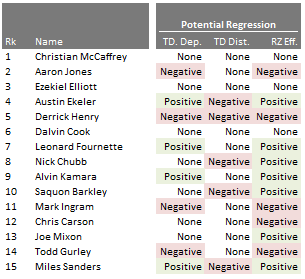
Now I know we’ve been through a lot so far, so here is a quick summary of what we covered so far in terms of the potential areas for regression for each player:
Given I’ve already crossed the 1,000-word mark, I’ll take a pause on this first segment before I’m at risk of putting you all to sleep if you haven’t passed out already.
In the next part of this regression series, I’ll be providing some more qualitative context by taking a look at their historical red zone efficiency metrics along with my conclusions regarding their regression risk heading into 2020. I will also be tying it all together by letting you know how I will be treating them in dynasty from a buy, sell or hold perspective.
Make sure you follow along as I’m sure some of the things I share might surprise you.
- Dynasty Fantasy Football Rookie Update: Clyde Edwards-Helaire, RB KC - May 15, 2020
- 2020 Dynasty Capsule: Cleveland Browns - February 20, 2020
- 2020 Dynasty Capsule: Tampa Bay Buccaneers - February 19, 2020


